

Buyers now use an average of 10 interaction channels during a buying journey, according to McKinsey's 2024 Global B2B Pulse Survey of 3,942 decision-makers, up from five in 2016. That kills any single channel plan. Effective demand generation for SaaS connects executive reach, content, intent signals and human follow up, then judges each part by meetings and pipeline, not impressions. I'd build it as a testable system. Every profile, campaign and signal either creates qualified pipeline or it gets cut.
Table of Contents
- Six-Step Demand Generation Plan for SaaS
- How to Set Positioning for Buying Committees
- Channel Mix Compared for SaaS Pipeline
- How to Build Campaigns Backward From Pipeline Targets
- How to Route Intent Signals Within Seven Days
- KPIs That Prove Pipeline, Not Impressions
- Run a 3-Month Pilot and Confirm the Scale Decision
Six-Step Demand Generation Plan for SaaS
Gartner's B2B buying journey research describes four recurring buying jobs, problem identification, solution exploration, requirements building and supplier selection, and buyers loop through them between digital research and human contact. Gartner reports that 75% of B2B buyers prefer a sales-representative-free experience, yet buyers are 1.8 times more likely to complete a high-quality deal when they use supplier-provided digital tools together with a sales representative rather than independently. Reach alone doesn't show movement. You need digital proof plus timely human help.
The six steps in order
- Positioning: Define the ICP, buyer problem and proof for each role. The marketing director owns this with the sales leader. Allow 2 to 3 weeks.
- Channel mix: Split budget across content, LinkedIn, intent outreach and ABM. The CMO owns the decision. Allow 1 week.
- Campaign math: Set revenue-backed funnel targets and stage rules. The head of demand generation owns this. Allow 1 to 2 weeks.
- Intent routing: Set signal rules, a named owner and a response SLA. Demand generation owns this with the SDR lead. Allow 2 weeks.
- Pipeline KPIs: Build stage metrics and source attribution in the CRM. RevOps owns this. Allow 2 to 4 weeks.
- Pilot: Run a 90-day test with agreed success criteria. The CMO owns it, with the CEO as sponsor.
For practical examples of how SaaS teams sequence these motions, Receiver's SaaS marketing articles are a useful reference library to compare against your own plan.
Build the measurement in step 5 before the pilot in step 6 starts. A pilot without a baseline can't prove anything.
Sequence matters more than speed. If positioning is vague, channels amplify the wrong message. If routing is slow, intent decays. If KPIs arrive late, you'll argue about anecdotes instead of deciding from pipeline.
How to Set Positioning for Buying Committees
Positioning comes before reach. It decides who an executive profile speaks to, what problem it names, and why a senior buyer should trust that person. Buy impressions first and you'll attract an audience you can't sell to.
Research summarized from the 2025 6sense B2B Buyer Experience Report in this buyer journey analysis indicates that buyers already know four of five vendors they will evaluate on the first day and set most requirements before contacting sales. The same source notes that peer recommendations in private channels were more trusted than vendor content. The messenger is part of the positioning.
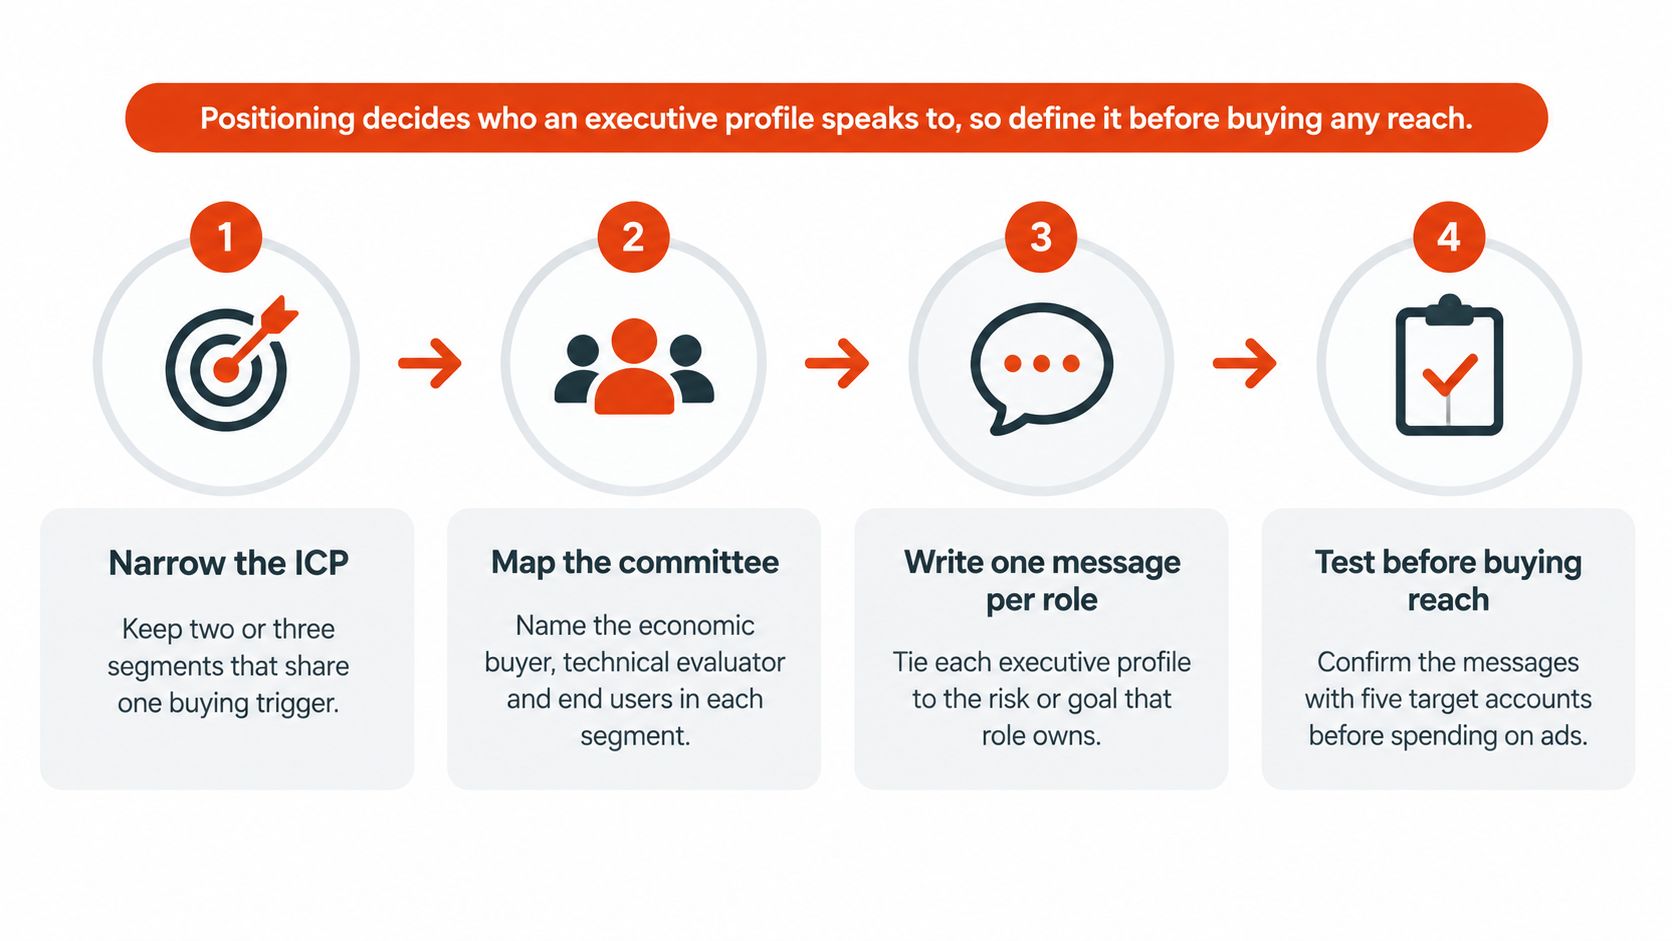
Five positioning steps
- Narrow the ICP: Keep two or three segments that share one buying trigger, such as a new regulation, a merger or a failed vendor rollout.
- Steal the buyer's language: Write the problem in words from call notes, not words from your product page.
- Map the committee: Name the economic buyer, champion and technical evaluator, plus the partner or director whose profile will carry the message to each role.
- Attach proof per role: Give each role one proof point, such as a named client case, a benchmark or a repeatable method.
- Test in conversation: Use the statement in ten real conversations. Rewrite it wherever prospects describe a different problem back to you.
Operating rules for executive profiles
Start strict, then tune during the pilot. Count buying intent only when several senior profiles inside one target account engage with the same problem topic within two weeks. Allow direct contact after three or more qualifying interactions from different people in that account. Don't treat one like as permission.
Write partner audience messages around the partner's client problem. Write company page messages around product proof. They serve different jobs, so they shouldn't sound identical.
Judge authority by two checks. First, does the engaged audience match your ICP by role and account? Second, what's the unfollow and spam report rate? High reach with the wrong audience is a cost, not an asset.
Finish with a three point check before you spend anything. Your statement names one segment, one problem and one proof point per role. If it names three problems, it will land with nobody.
Channel Mix Compared for SaaS Pipeline
Fund the channel that produces meetings first and the one that compounds second. Each row does a different job in the funnel, so track each against its own metric instead of one shared count.
| Channel | Job in the funnel | Time to first meeting | Best-fit account profile | Metric to track |
|---|---|---|---|---|
| Content and SEO | Earns visits from buyers in research | 3-6 months | Categories with active search demand | Engaged target accounts per month |
| LinkedIn personal branding | Builds trust with partners and directors | 2-4 months | Mid-size consulting and B2B software committees | Engaged senior profiles per month |
| Intent-based outreach | Contacts accounts already researching | 1-3 weeks | Accounts with visible surge and ICP fit | Meetings within 7 days of signal |
| ABM | Works named accounts across several roles | 1-2 quarters | Named list of 50-200 accounts | Accounts with multi-role engagement |
| Events and trade shows | Reinforces known contacts | Set by event calendar | Existing relationships | Qualified meetings per event |
The table forces a trade-off. Content compounds but it's slow. Intent outreach is fast but it only works where a signal exists. Events deepen known relationships but they're a weak source of new accounts. ABM coordinates a committee, yet it needs a quarter or more and a disciplined account list.
LinkedIn sits in the middle. In 2025, 85% of B2B marketers said LinkedIn delivered the best value among social-media platforms, according to the Content Marketing Institute's B2B content research as reported by Copylume's B2B content statistics. Value still depends on lead quality, so apply Scéaled's guide to LinkedIn lead quality when you set qualification rules for paid and organic activity.
A starting split for quarter one
For an event dependent consulting or B2B software firm, I'd start here:
- Intent outreach, about 25%: Meetings arrive fastest here, within 1-3 weeks, because every contact goes to an account already showing a surge with ICP fit.
- ABM, about 15%: A slower multi-role bet on a named list of 50-200 accounts. Expect a quarter or more before it produces meetings, so fund it as committee coverage rather than a speed play.
- Partner and director LinkedIn activity, about 35%: This builds the authority that makes outreach land instead of reading as cold spam.
- Content, about 25%: Answer the questions buyers type into search and AI tools, especially comparison and implementation questions.
Treat that split as a hypothesis. Rebalance at week 8 using meetings and opportunities per channel, not cost per lead. If intent outreach books meetings that stall before opportunity stage, tighten the surge and fit rules before you raise volume.
Ploot is one way to run the partner audience and intent layer. If you build it in-house, keep the same guardrails: one approved profile per senior person, no automated cold requests, and every contact tied to a visible signal. Keep events for named accounts you already know. Don't make them your only source of new meetings.
How to Build Campaigns Backward From Pipeline Targets
| Funnel stage | Median conversion | Volume needed for 10 wins |
|---|---|---|
| Visitors | 2.8% visitor-to-lead | 37,800 |
| Leads | 34% lead-to-MQL | 1,060 |
| MQLs | 19% MQL-to-SQL | 360 |
| SQLs | 61% SQL-to-opportunity | 68 |
| Opportunities | 24% opportunity-to-won | 42 |
| Closed-won customers | About 0.95% lead-to-won overall | 10 |
Those volumes come from SaaS median rates of 2.8% visitor-to-lead, 34% lead-to-MQL, 19% MQL-to-SQL, 61% SQL-to-opportunity and 24% opportunity-to-closed-won, reported in Digital Applied's B2B marketing statistics. At median performance, 100 leads may yield roughly one closed customer. Judge campaigns on pipeline value and sales velocity, not MQL count.
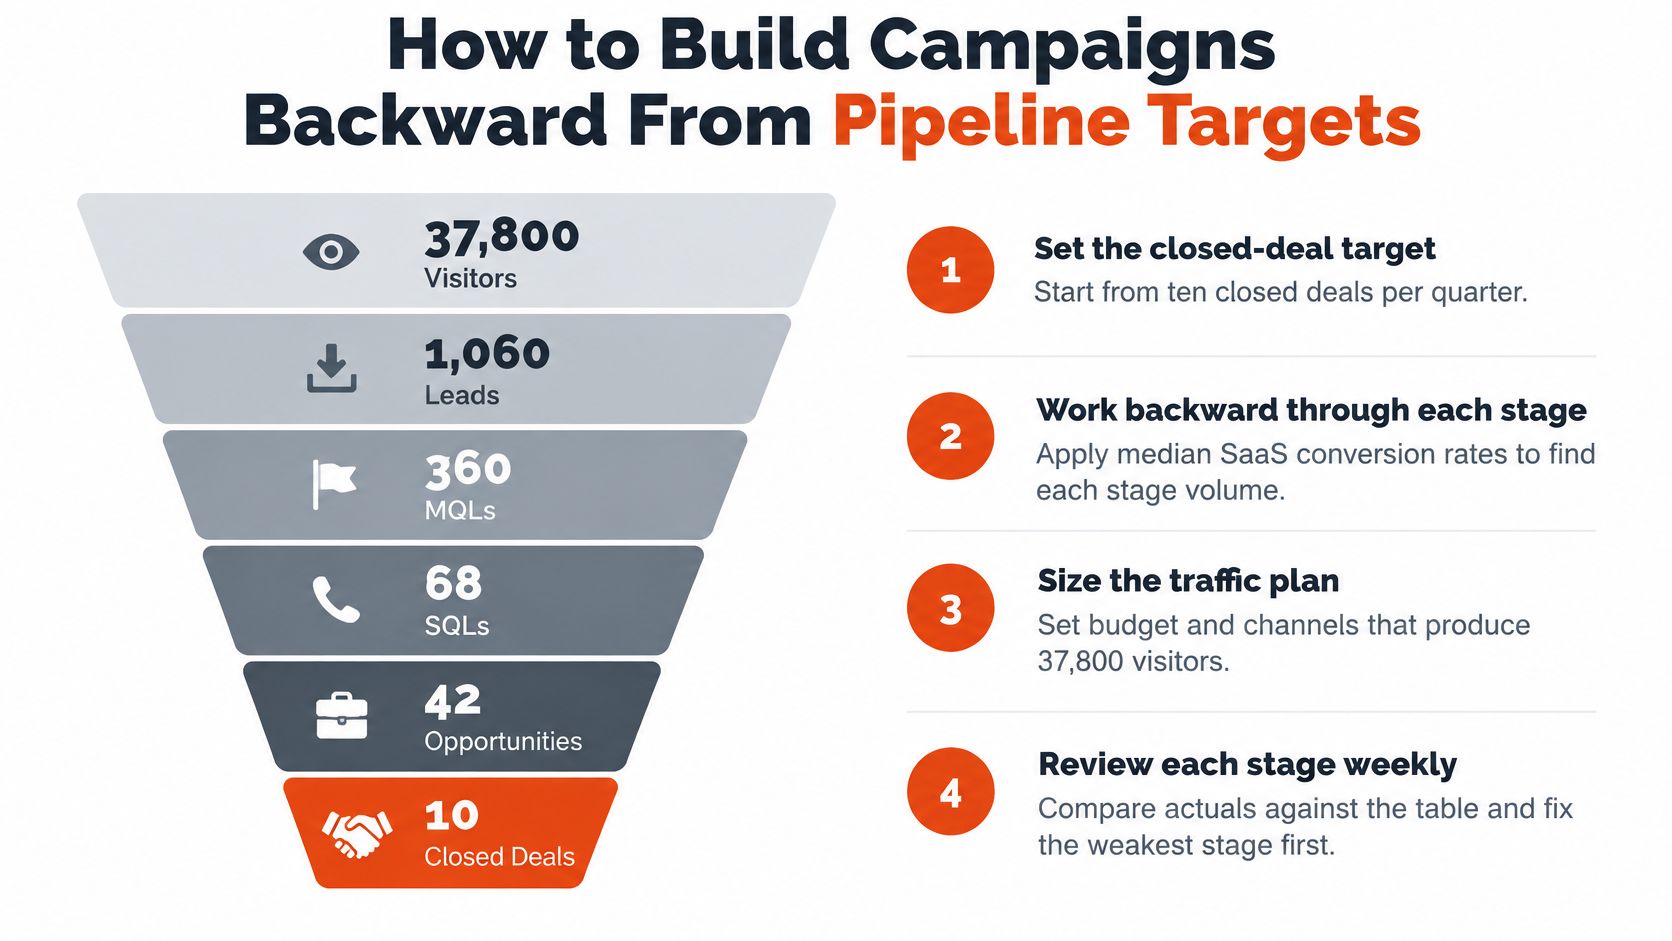
Work backward in six steps
- Set the sales target and average contract value. Ten wins means nothing until finance and sales agree what a win is worth and which segments count.
- Apply your win rate and work backward. Calculate required opportunities first, then SQLs, MQLs, leads and visitors. Each stage gets an owner and a weekly target.
- Score on fit plus engagement. A narrow ICP keeps cheap, unqualified volume out. Observable engagement tells you whether a fitted account is moving.
- Agree MQL to SQL acceptance in writing. Define required role, account fit, evidence of a problem, and the rejection reasons sales must log. Without rejection reasons, marketing can't fix targeting.
- Tag everything in the CRM. Every lead needs consistent source, campaign and opportunity attribution, including the executive profile and signal that triggered contact.
- Segment and use rolling cohorts. Split rates by market, deal size, channel and sales cycle. Don't mix this week's leads with mature opportunities and call the result a conversion rate.
Where teams misread the math
Say a team needs ten wins but budgets for 10,000 visitors. The table shows the gap immediately. They either fund roughly four times the traffic, improve a weak stage, raise contract value, or lower the target. Hoping isn't a fifth option.
Benchmarks are a starting point, not a promise. A consulting firm with a six month cycle will see different stage timing than a product-led SaaS team with a trial. Replace the medians with your own history after the first full cycle, stage by stage. Keep the benchmark column visible so you can see whether you're beating the market or explaining away a leak.
Review the weakest stage first each week. If visitor to lead is fine but MQL to SQL collapses, more traffic makes the problem bigger and more expensive.
How to Route Intent Signals Within Seven Days
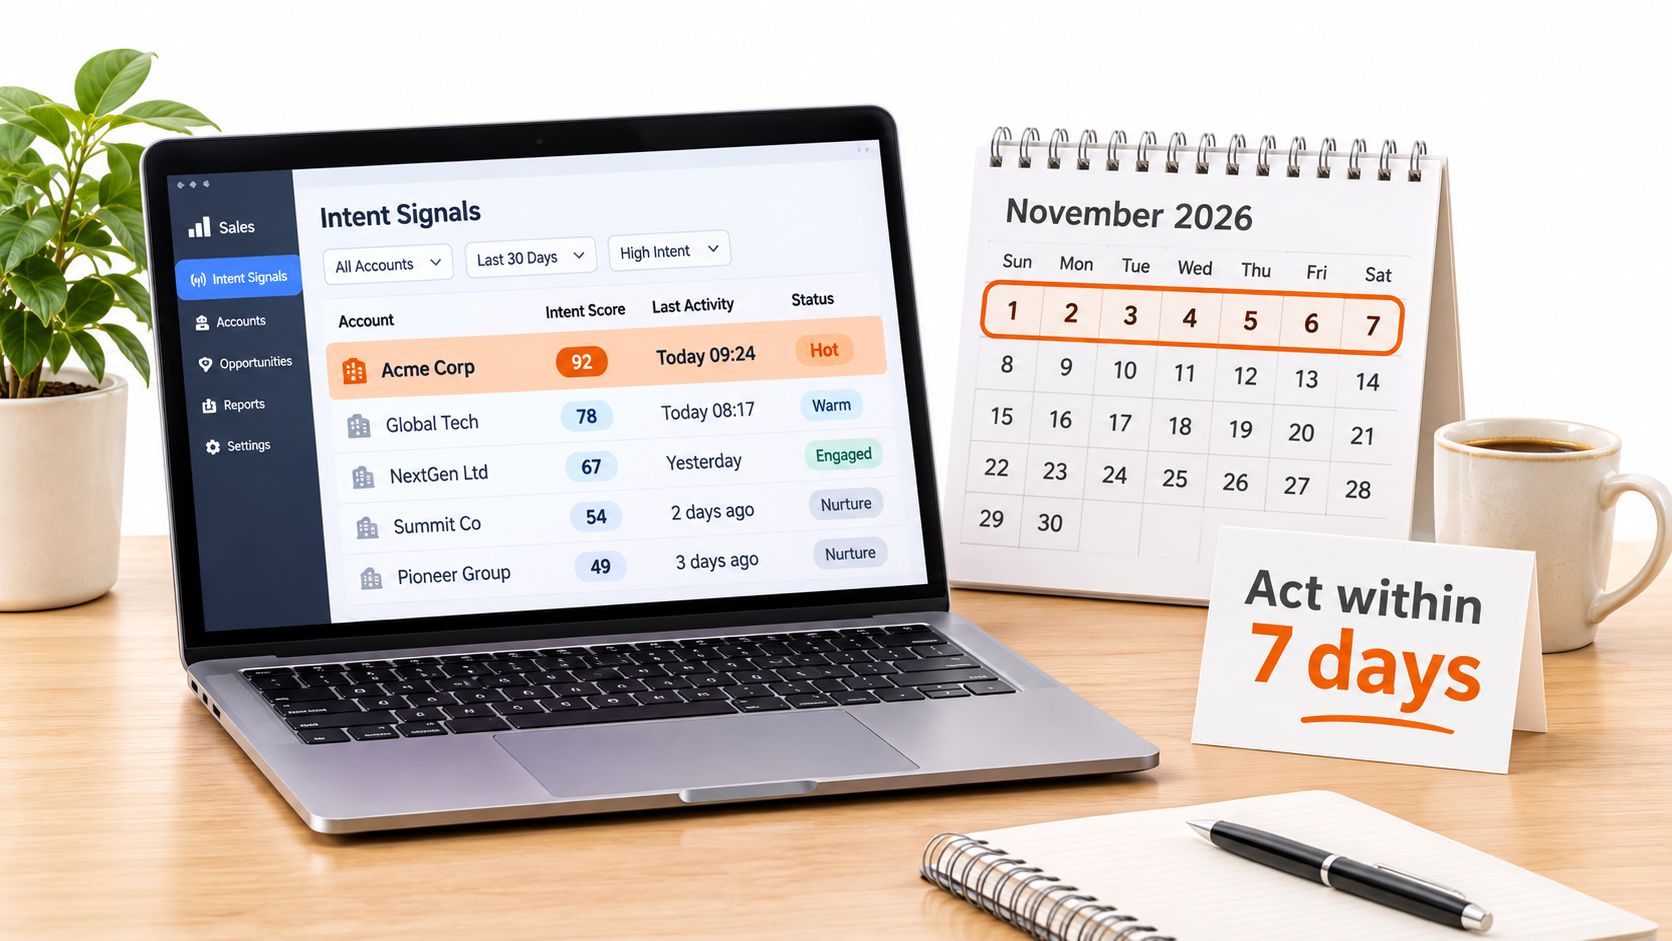
Speed is the variable you control. The Starr Conspiracy's ABM demand generation benchmarks report 4% to 7% intent-to-meeting conversion when signals are activated within seven days of a buying surge, falling to 1% to 2% when activation takes more than 21 days, with a 2.5x engagement lift for acting inside that first week. Slow routing doesn't just delay pipeline. It removes most of it.
That makes routing speed a budget decision, not an ops detail. An executive profile with real reach in your target accounts is only a pipeline input if a named owner acts on what the audience signals. The dashboard view below is where that clock should be visible every morning.
The five step routing model
- Detect: Spot a relevant surge or high intent behaviour among partners, directors and senior managers in your target audience. Repeated research on one problem beats a single page view.
- Validate: Confirm the account matches the ICP and the person holds a role that can influence the decision. Human review happens here, before outreach.
- Route within hours: Assign one named owner, not a shared queue. Set a maximum response SLA and escalate automatically when it's missed.
- Message the observed problem: Write a role specific message tied to the business problem you observed. A generic meeting request tells the buyer you saw a signal but learned nothing.
- Record the outcome: Log meeting, opportunity and revenue against signal type and days to activation. That's how you learn which signals deserve budget.
Step five is where the program pays for itself. Once meetings and pipeline are tracked per activated profile and per signal type, you can compare a partner's LinkedIn audience against paid channels on the same unit: meetings booked. Signals that convert get more profiles behind them. Signals that stall get cut from the routing rules.
If your team needs a shared definition before building these rules, start with this overview of buying signals and how sales teams use them.
The short walkthrough below shows how signal based prioritisation works in practice, which is useful when you're training owners on what to act on first.
Hard rule: Never send from a senior person's profile without that person's approval of the message.
The main pitfall is acting on weak or stale intent without validation. You'll create irrelevant outreach and damage the executive credibility that made the audience valuable. Suppress contacts with insufficient evidence. Fewer, better timed contacts will beat high volume guessing on meeting-to-opportunity rate every time.
KPIs That Prove Pipeline, Not Impressions
| KPI | Question it answers | How to read it |
|---|---|---|
| Meetings from target accounts | Is outreach creating conversations? | Weekly, split by signal type |
| Meeting-to-opportunity rate | Are meetings qualified? | Compare by signal type and activation window |
| Opportunity-to-win rate | Does signal quality hold through close? | Rolling cohorts, not mixed ages |
| Pipeline value per activated profile | What does each partner or director profile return? | Total pipeline divided by profiles activated |
| Sales cycle length | Does the program speed deals up? | Days from opportunity to close, quarterly |
| Direct traffic and branded search | Is authority building demand? | Quarterly trend, not monthly swings |
| Share of spend on demand versus brand | Is the budget balanced for growth? | Compare the split against your own historical mix and current growth target |
Read the first three KPIs weekly. Meetings from target accounts show activity quality. Meeting-to-opportunity rate shows whether sales agrees those meetings were real. Opportunity-to-win rate shows whether signal quality survives procurement, budget checks and competition. Split all three by signal type or you'll average your best and worst sources into a meaningless number.
The slower indicators need a quarterly lens. Direct traffic, branded search and engaged senior profiles tell you whether authority building is creating future demand that hasn't become a lead yet. Pipeline value per activated profile is the bridge metric. It connects partner audience spend directly to revenue and lets you compare profiles fairly, which is how executive reach stops being a brand line item and becomes a testable input to pipeline. For the underlying pipeline discipline, this guide to B2B sales pipeline management covers stage hygiene, and when you need the finance view, use this method to calculate profit-driven marketing ROI instead of reporting attributed revenue alone.
Why attribution alone won't settle the argument
A 2025 benchmark survey reported in the 2025 Demand Generation Benchmark Survey found that 57% of respondents were actively measuring campaign attribution, while 33% expected to implement measurement within a year and 10% had no plans to do so. Even mature multi-touch models miss peer recommendations, private communities and AI answers consumed before a buyer becomes identifiable.
Combine four evidence types instead. Use CRM attribution, self reported discovery on forms and calls, branded search movement, and account level engagement. Then validate with a quarterly holdout.
Pause outreach in a matched group of accounts for four to six weeks and compare meeting and opportunity rates against the active group. A real demand program shows up in that gap.
Finally, check spend balance. Pull your current demand-versus-brand split and compare it against your own historical mix and the growth target you signed. If you're starving authority building, your capture channels will eventually run out of demand to capture.
Run a 3-Month Pilot and Confirm the Scale Decision
A pilot earns budget only if it can lose. Set the test so executive LinkedIn reach is treated like any other pipeline input: same baseline, same holdout logic, same decision date.
| Weeks | Focus | Success gate |
|---|---|---|
| Weeks 1-2 | Agree ICP, success criteria and baseline pipeline | Written targets and baseline numbers signed by sales |
| Weeks 3-6 | Launch signals, outreach and content on two segments | Response SLA met on most signals and qualified conversations logged |
| Weeks 7-10 | Drop weak signal types, tighten routing and start the matched holdout at week 7 | Holdout running and meeting-to-opportunity rate above baseline |
| Weeks 11-13 | Compare holdout and active groups, then decide | Pipeline per profile calculated and scale, adjust or stop decision signed |
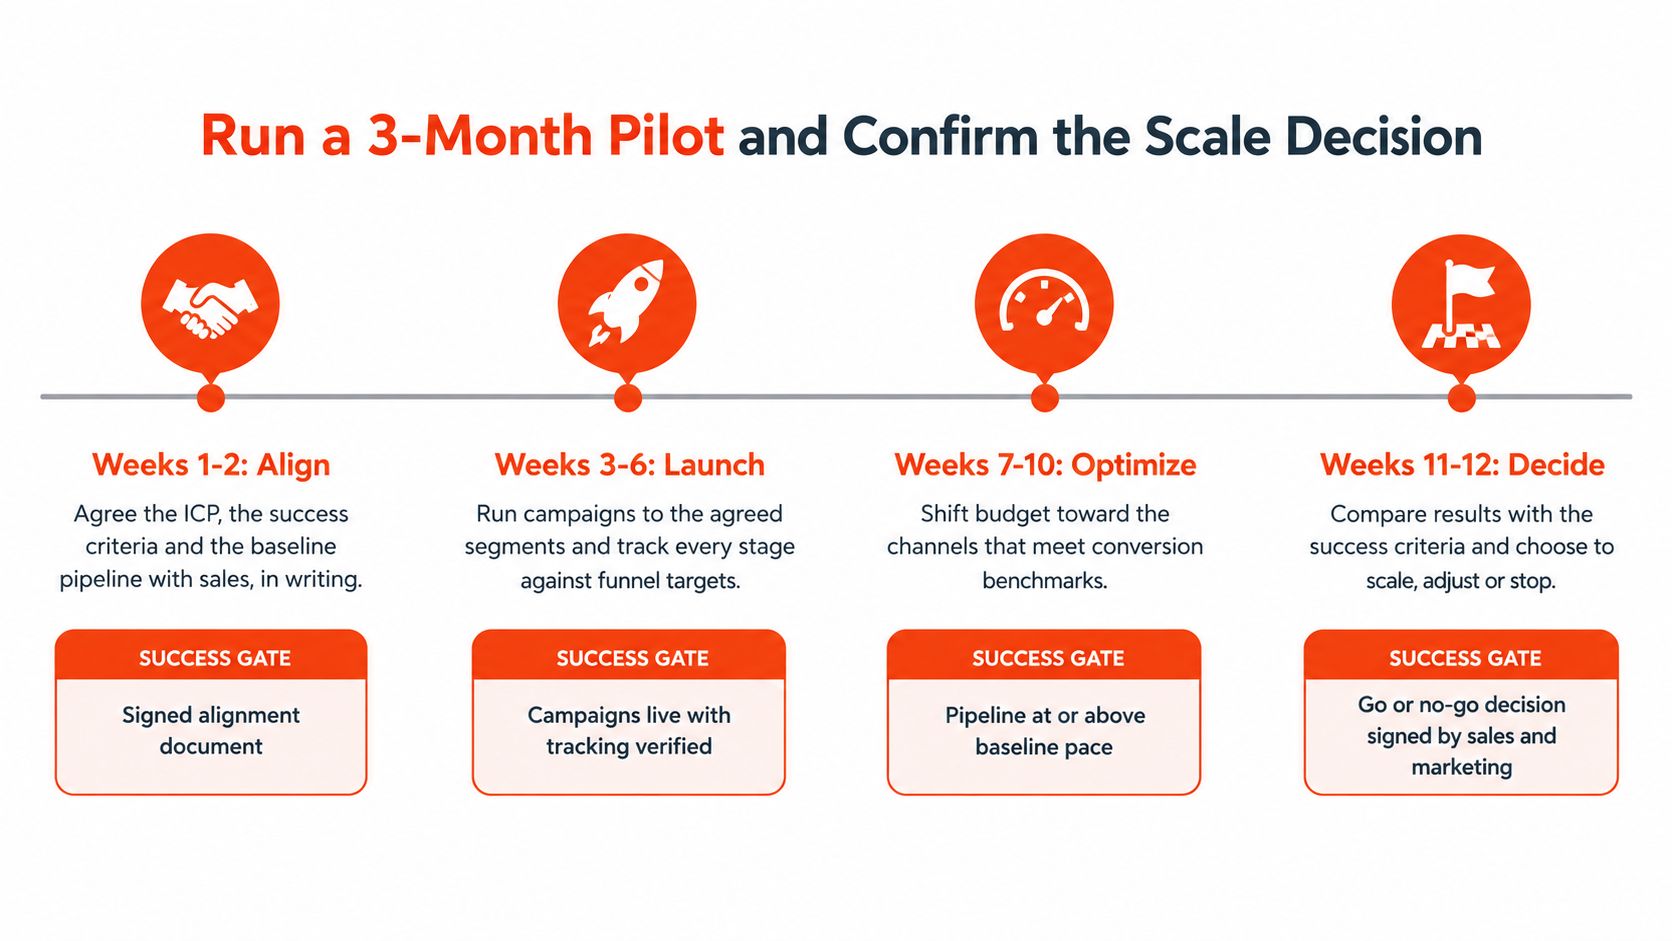
Phase gates that force a decision
Weeks 1 to 2, align. Agree the ICP, success criteria and baseline pipeline with sales, in writing. Use a shared pilot success criteria template so marketing and sales sign the same definitions for a qualified meeting and an opportunity. No signed baseline, no launch.
Weeks 3 to 6, launch narrow. Run signals, outreach and content on two segments only. Narrow scope makes results readable and keeps executive profiles focused on one problem per audience. Track SLA compliance daily in this phase, because early routing habits become permanent.
Weeks 7 to 10, optimise ruthlessly. Remove the weakest signal types. Tighten the response SLA where owners are missing it. Pause a matched group of accounts at week 7 and keep it paused through the decision window. Compare meeting-to-opportunity rate with the baseline by segment, profile and signal. Shift effort toward combinations that create opportunities, not just replies.
Weeks 11 to 13, decide. Compare the holdout group, paused from week 7, against the active group, so the four-to-six-week comparison is complete before the week 12 decision. Calculate pipeline value per activated profile and cost per opportunity. Then choose scale, adjust or stop. Don't extend a pilot because the activity looked busy.
Whatever provider or in-house team runs it, the week 12 decision rests on three numbers: pipeline created against baseline, meeting-to-opportunity rate by signal type, and cost per opportunity. Keep the guardrails constant in any setup. One approved profile per senior person. No automated cold requests. Every contact tied to a visible signal.
Confirm the criteria before budget is committed. A pilot without agreed targets ends in a debate about what success meant.
I'd rather stop a pilot that hit meetings but missed opportunities than scale it and fill the CRM with polite conversations. For demand generation for SaaS, the scale decision is a pipeline decision, and the numbers above are enough to make it.
If you want executive LinkedIn reach treated as a measurable pipeline input, Ploot builds the LinkedIn audiences of your partners, directors and senior managers, detects who in that audience shows buying intent, and contacts them at the right moment to book qualified sales meetings. Start with a 3-month pilot with agreed success criteria, judge it on pipeline per activated profile, and scale only if the numbers clear your baseline.