

The most popular advice on measuring account-based marketing is incomplete: track engagement, influenced pipeline and revenue. Those metrics describe what happened around your program, but they don't establish what happened because of it. An account might have booked a meeting without your campaign, and an existing opportunity might have closed without another LinkedIn interaction.
If you're deciding how to measure account based marketing, start with a harder question: what evidence would persuade finance that the program created additional commercial value? The answer requires account-level progression, explicit attribution rules and a credible comparison group, not a larger engagement report alone.
Table of Contents
- Core ABM Metrics Across Activity, Progression and Revenue
- Set Up the Measurement Foundation in Five Steps
- Score Account Engagement Without Vanity Metrics
- Prove Incremental Impact With a Control Group
- Build the Account Dashboard for Finance Review
- Lock Criteria and Run the 90-Day Pilot
Core ABM Metrics Across Activity, Progression and Revenue
Measure ABM by whether named target accounts move through the commercial funnel, not by impressions or individual lead counts. In a 2019 B2B Marketing survey summarized by Tribal Impact, revenue was the most commonly reported ABM success measure at 66%, followed by sales-qualified opportunity pipeline at 65%. Organizations reporting strong ABM returns tracked pipeline generated and revenue at 75%, meetings set and target-account pipeline at 67.5%, and marketing-qualified leads at 63%.
That hierarchy matters. Keep MQLs available for operational reporting, but don't let a contact-level count outrank evidence of account-level commercial progress.
Separate signals from outcomes
Organize the scorecard into activity, progression and revenue. Activity tells marketing whether the intended audience is responding. Progression tells sales whether that response is becoming a buying process. Revenue measures the commercial outcome, with sourced and influenced pipeline retained as intermediate measures rather than treated as money earned.
Among 107 B2B go-to-market leaders surveyed for N.Rich's 2025 State of ABM report, 77% of organizations running ABM reported increased pipeline, 69% reported improved engagement at target accounts, and 55% reported higher win rates. Those are reported outcomes across respondents, not conversion targets for your own account list.
ABM metrics by layer, with directional benchmarks
| Layer | Metric | What it tells you | Directional benchmark |
|---|---|---|---|
| Activity | Engaged target accounts | Accounts with a qualifying pattern of contacts or an intent signal | Pre-agreed qualification threshold |
| Activity | Engagement intensity | Weighted events per account, such as repeat visits and replies | Compare with each account's baseline |
| Progression | Buying-group coverage | Engaged relevant roles divided by estimated relevant stakeholders | Set from your Tier-1 baseline |
| Progression | Week-over-week engagement growth | Momentum that can precede stage movement | Validate against own cohorts |
| Progression | Qualified account to meeting rate | Whether engaged accounts accept a real conversation | Compare with matched eligible accounts |
| Progression | Time to opportunity | Speed from first qualifying signal to opportunity | Validate against own cohorts |
| Revenue | Sourced and influenced pipeline | Opportunities ABM created or materially engaged | Apply agreed attribution rules |
| Revenue | Win rate and average deal size | Whether target accounts buy and at what value | Compare within equivalent account tiers |
Make the account the unit of analysis
A target company can generate activity from partners, technical evaluators and procurement contacts before producing an opportunity. Connect those interactions to its CRM account record so that growing contact volume doesn't masquerade as growing demand.
Target selection also determines what the scorecard means. The Social Search's resource on ICP targeting for account based marketing is useful when defining eligibility before measurement begins. For a profile-led channel, translate that account list into the operating approach described in our guide to account-based marketing on LinkedIn.
Metric test: Can a sales leader identify the named accounts behind the number and explain what changed commercially?
A useful activity metric supports that diagnosis. It doesn't substitute for it.
Set Up the Measurement Foundation in Five Steps
A dashboard can't repair ambiguous account definitions after launch. Establish the reporting structure before outreach so sales and marketing classify the same interaction consistently.
The Demand Gen Report marketing attribution survey found that 54% of marketers conduct attribution analysis, while 95% of organizations measuring ABM still track conventional funnel metrics alongside ABM-specific measures. Keep those funnel records, but connect them to an account structure that supports buying-group analysis.
Establish the account record before activation
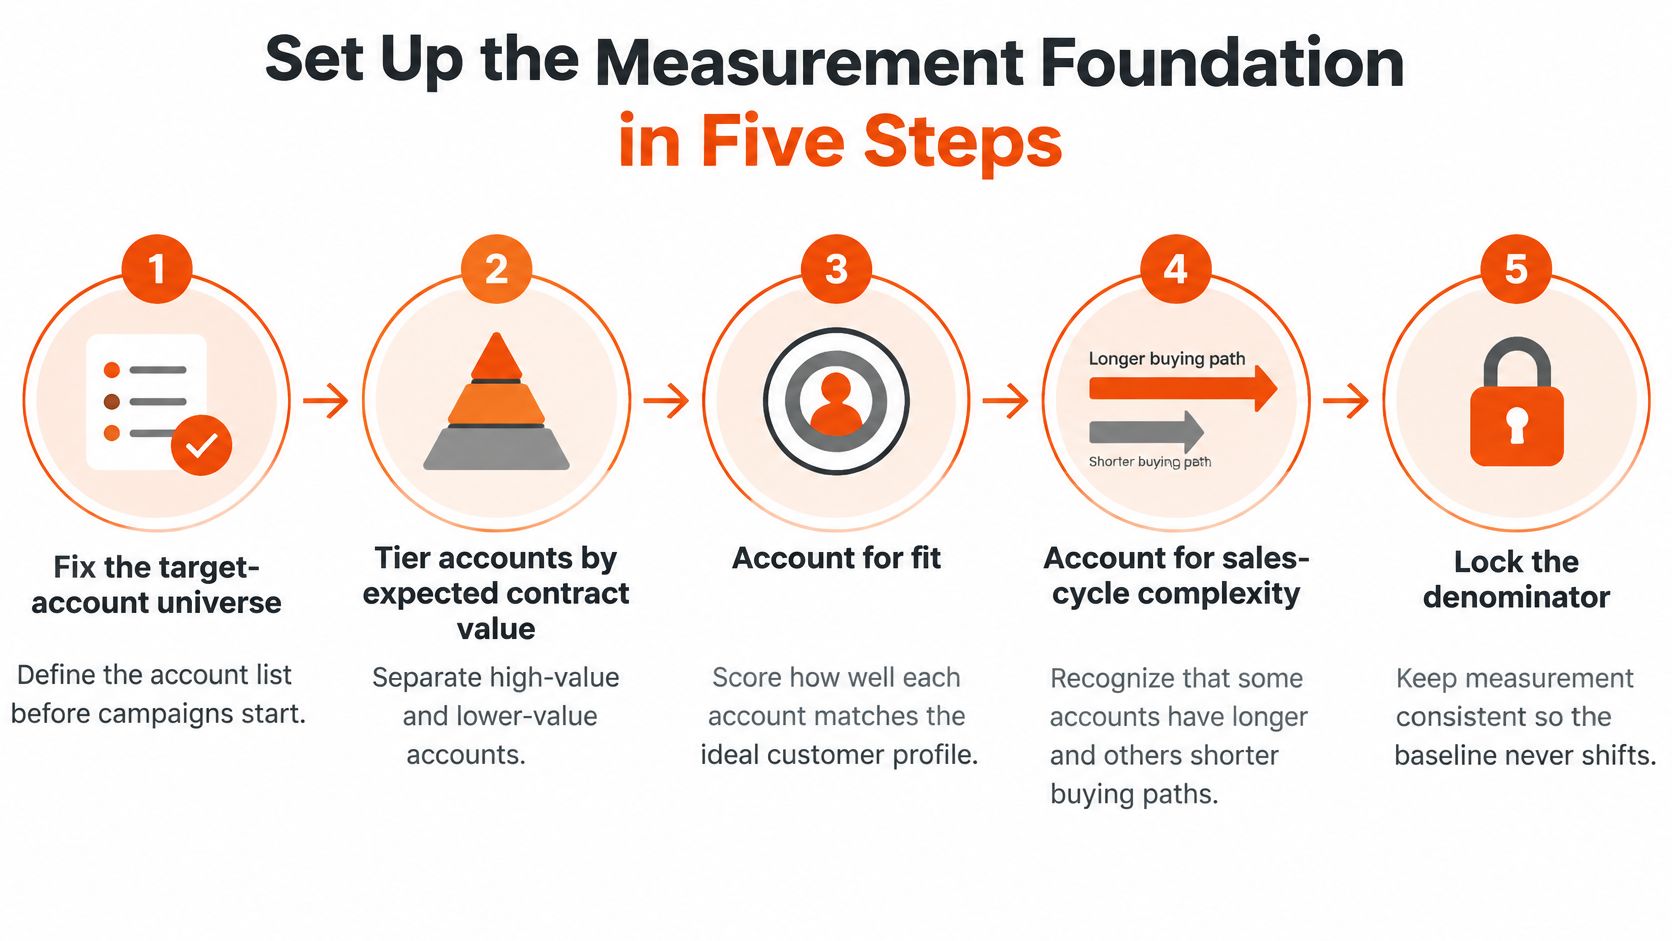
Fix the target-account universe and tiers. Export the eligible account list and assign tiers using expected contract value, ICP fit and sales-cycle complexity. Don't add promising accounts retroactively to improve the result; record additions as a separate cohort with their own activation date.
Map the buying group. Identify the economic buyer, technical evaluator, user and potential champion, marking unknown roles explicitly rather than assuming they don't exist. The common mistake is mapping only the contact the salesperson already knows, which hides the work needed to build broader support.
Join records through a CRM account ID. Associate contacts, campaign interactions, meetings, opportunities and closed-won records with the same canonical account record. Resolve duplicate company records and subsidiaries before launch, rather than relying on similar company names to join exports later.
Define the qualification threshold. Specify the combination of stakeholder engagement or verified buying-intent signals required before an account becomes qualified. Don't choose the threshold after seeing which accounts booked meetings, because that makes the measurement rule dependent on the result.
Capture the baseline. Record existing pipeline, meetings, historical win rate and sales-cycle duration using a documented observation window. Skipping this step leaves the team unable to distinguish newly created demand from commercial activity already underway.
The account-universe portion of the setup deserves particular care because it determines the denominator used throughout the pilot.
Assign ownership to definitions
At Ploot, we define the client's ICP and how each team member writes on day one. For measurement, turn that ICP into explicit inclusion and exclusion rules that the CRM owner can apply without interpreting a campaign manager's intentions.
Give marketing operations responsibility for record integrity and sales responsibility for accepting or rejecting qualified accounts. Require a rejection reason, such as missing authority, no relevant need or incorrect account fit.
A clean launch record contains an account ID, a tier, a buying-group map and a dated baseline. Missing information should be visible, not silently treated as zero.
Score Account Engagement Without Vanity Metrics
A website visit from a contact isn't evidence that the buying group is ready. Reporting the entire company as engaged hides the difference between an interested reader and an emerging purchase process.
According to 6sense's analysis of B2B marketing measurement, roughly three-quarters of B2B organizations report measuring engagement at buying-group level, yet only 33% report tracking pipeline from target accounts. Measuring a group's activity is therefore not the same as demonstrating its commercial progression.
A useful analytics view should help the salesperson inspect the people and actions behind an account score.

Keep breadth, depth and progression separate
Breadth measures relevant buying-group roles reached. Depth captures repeat engagement and actions that suggest active evaluation. Progression records sales acceptance, meetings and opportunity movement.
Don't compress these into an unexplained total. A salesperson should be able to distinguish broad but superficial interest from concentrated intent around a champion.
Example weights for an engagement score
These are illustrative scoring settings, not research benchmarks. Adapt them to your historical account journeys.
| Event | Example weight | What it signals |
|---|---|---|
| Single page view | 1 | Low intent, breadth only |
| Repeat visit by same role | 3 | Depth |
| High-intent content such as pricing or case study | 3 | Buying intent |
| Reply to outreach | 4 | Response quality |
| Referral to another role | 4 | Breadth across the buying group |
| Booked meeting | 5 | Progression |
Filter unidentified traffic before assigning readiness. Anonymous activity can prompt investigation, but it shouldn't satisfy a rule requiring a verified person, relevant role and ICP fit.
For example, an account with a CFO visit, repeat technical-evaluator engagement and a booked meeting should rank above repeated page views from an unidentified visitor. Cap repeated low-intent events so browsing frequency alone can't push an account into sales readiness.
For post-level diagnostics, Linkboost's LinkedIn engagement rate calculation tool can support content analysis. Keep that channel metric separate from account qualification.
Turn the score into an outreach decision
Define sales readiness as a documented combination of relevant role coverage and a progression signal, then test whether that rule would have identified historical won accounts. Review false positives as carefully as successful handoffs.
For additional context on the topic, watch the following video.
In our process, a sales opportunity is a real person within the ICP who has shown buying intent through content interaction, a profile visit or a matching signal, and reaches the salesperson with context. That handoff isn't automatically a CRM opportunity with an agreed deal value.
We don't do mass prospecting. We contact low volumes of people who have already interacted with the client, its company or its sector. Build the scoring sheet around that context, with account-level fields for role coverage, interaction quality, stage and threshold-crossing date.
Prove Incremental Impact With a Control Group
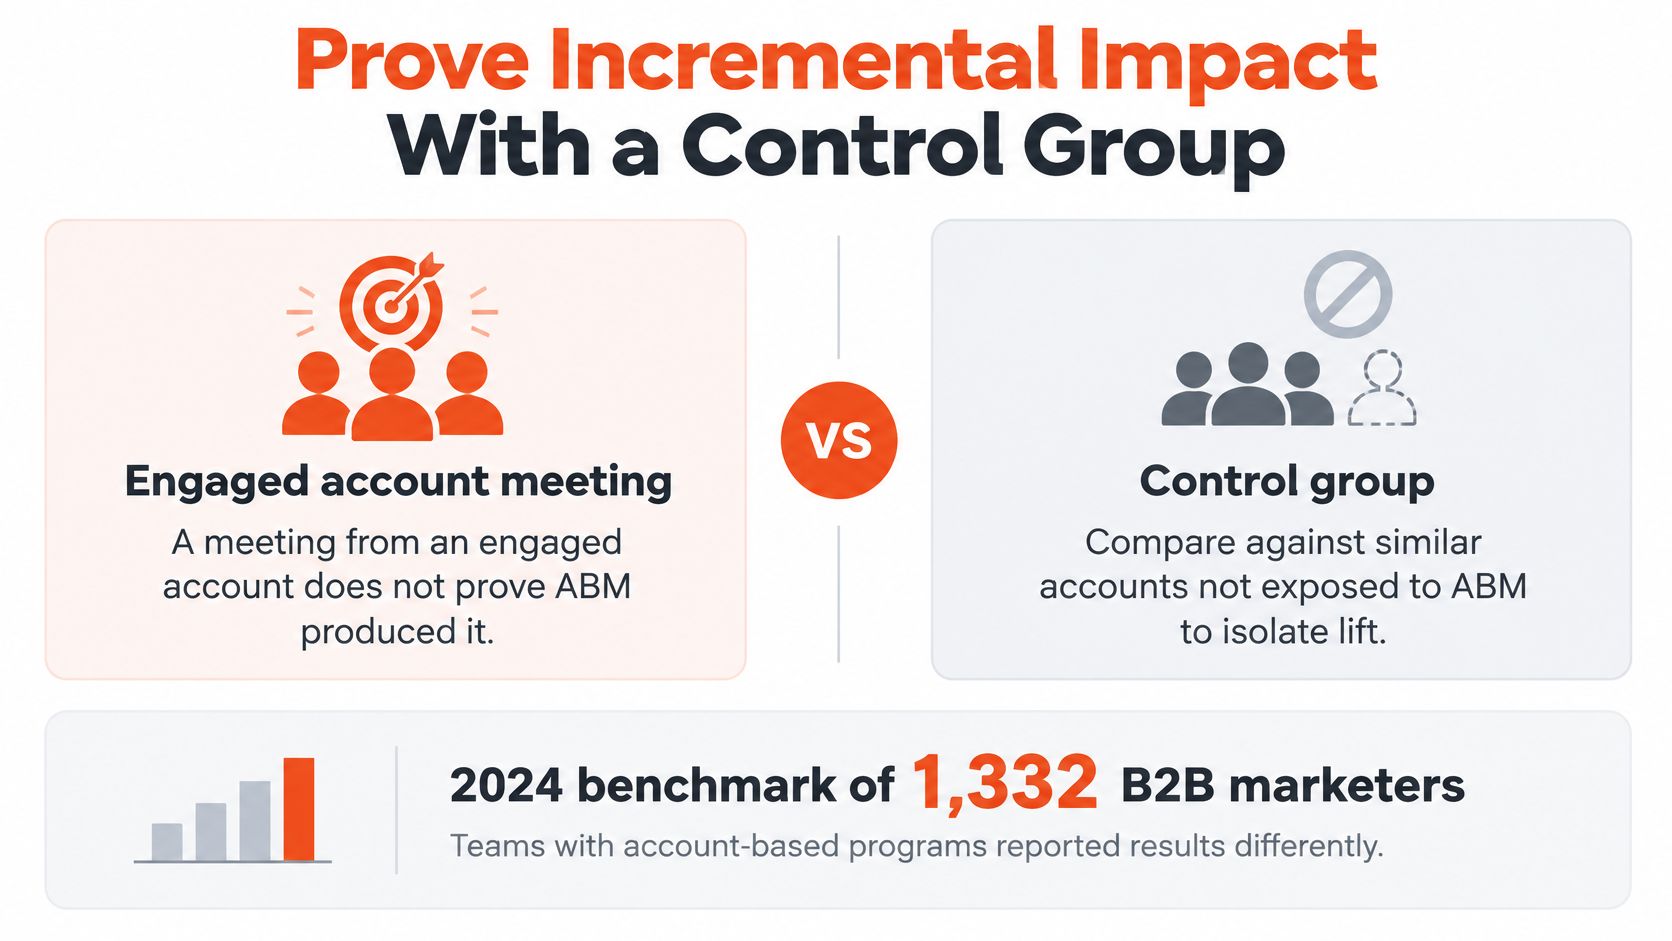
A meeting from an engaged account doesn't prove ABM produced it. The account may already have been evaluating suppliers, responding to a referral or speaking with sales.
The 6sense 2024 ABM benchmark synthesized responses from 1,332 B2B marketers and found higher reported financial performance among teams with account-based programs, but the reported effect size was very small, Cohen's d of 0.058. That association doesn't establish that ABM caused the difference.
Distinguish attribution from additional impact
Set attribution rules before launch and apply them consistently.
| Classification | Required evidence | What it does not prove |
|---|---|---|
| Sourced pipeline | The program was the qualifying origin of the opportunity | That the opportunity couldn't have emerged otherwise |
| Influenced pipeline | Meaningful program engagement with an existing opportunity | That ABM created the opportunity or its full value |
| Closed-won revenue | A completed, won transaction under the CRM definition | That all revenue was incremental to the program |
Influenced pipeline is an association measure. Don't present the full value of an existing deal as additional revenue because a stakeholder engaged with content.
The comparison should distinguish participation from the counterfactual: what similar accounts did without activation.
Build a credible comparison
Compare activated accounts with eligible accounts that haven't yet received the program. Match them on tier, company size, industry, existing opportunity status and expected sales-cycle complexity.
Where practical, randomly assign eligible accounts to activation or holdout. Matching improves comparability, but it can't remove every unobserved difference, such as a salesperson knowing which accounts already have budget.
- Use equivalent observation windows. Give both groups comparable time to reach a meeting or opportunity.
- Track other sales activity. A major difference in outbound effort or event exposure weakens the comparison.
- Publish denominators. Show account counts beside opportunity rates, win rates and average deal values.
If a permanent holdout isn't feasible, stagger activation and use later-starting accounts as a temporary comparison. State the timing gap and avoid claiming that this removes seasonal or market effects.
Finance check: Report the difference between comparable groups, not just the total pipeline attached to activated accounts.
Calculate opportunity-rate uplift by subtracting the comparison group's opportunity rate from the activated group's rate. Report uncertainty alongside the result, particularly when few opportunities have matured.
For the financial interpretation, Purple Engage's marketing ROI guide provides useful context. Keep the distinction explicit: attributed revenue, incremental revenue and profit-based ROI aren't interchangeable.
Build the Account Dashboard for Finance Review
Finance needs a dashboard it can reconcile with the CRM, not a presentation assembled from incompatible channel exports. Use an account-level view for diagnosis and linked opportunity records for financial totals.
The Demand Gen Report measurement and attribution benchmark survey found that 73% of B2B marketers were increasing their emphasis on measurement and attribution to demonstrate marketing ROI. More reporting only helps if the underlying classifications remain consistent.
Organize the dashboard around decisions
Keep each target account on a canonical row keyed to its CRM account ID. Group the fields so reviewers can move from observed activity to commercial status without switching files.
| Dashboard group | Fields to include | Reviewer's decision |
|---|---|---|
| Account context | Account ID, tier, cohort, activation date | Is this account eligible for this comparison? |
| Activity | Reached roles, engagement score, recent qualifying signals | Does sales have a relevant reason to act? |
| Progression | Coverage, current stage, qualification date, meetings, opportunity date | Where is the buying process stalled? |
| Commercial value | Sourced pipeline, influenced pipeline, closed-won value | What value can finance reconcile? |
| Evidence quality | Comparison cohort, observation window, missing fields, maturity note | How confidently can we interpret the result? |
Display activated and comparison cohorts together. A reviewer shouldn't have to request another report to discover whether similar untreated accounts progressed at the same rate.
Prevent financial double counting
Maintain opportunity values at opportunity level, even when the dashboard aggregates them by account. Otherwise, joining contacts and activities can duplicate the same deal value across multiple rows.
Use mutually exclusive classifications in headline program totals. If an opportunity has additional program touches, preserve them in an influence ledger rather than adding its full value repeatedly to combined pipeline.
- Label actuals and estimates. Keep modeled revenue separate from CRM closed-won value.
- Show evidence maturity. Flag small samples, incomplete follow-up and opportunities still open.
- Expose costs. Include agreed program costs and internal effort when presenting financial returns.
Use the same underlying file for weekly sales action and monthly program review. Different filters are useful; conflicting definitions aren't.
Our ROI calculator estimates added revenue from leads, conversion rate and average contract value, counting 21 working days per month. Treat its output as a planning scenario to compare with observed results, not as evidence that the program caused revenue.
Lock Criteria and Run the 90-Day Pilot
Agree on decision rules before outreach begins. Each success criterion needs a target, an owner, a review date and a comparison method. Without those, the final review can turn into a debate about which results count.
Use a pilot success criteria sheet to record the account universe, qualification requirements, qualified meetings per activated profile, opportunity creation, pipeline and elapsed time. Set targets from your baseline and commercial requirements, then get sales and finance to agree before launch.
Budget from realistic assumptions
Estimate potential pipeline as eligible target accounts × expected opportunity conversion rate × expected contract value. Base the conversion rate on an appropriate historical cohort, and label the result as a forecast.
For profile-led execution, check that publishing, response handling and sales follow-up capacity match the expected opportunity volume. Separate the accounts selected from those the team can meaningfully activate during the pilot.
The INFUSE ABM measurement framework presents time to opportunity below 60 days as an efficiency indicator and week-over-week engagement growth of at least 25% as a directional signal that may precede stage progression. Treat these as reference points, not universal pass marks. Check their relevance against your consulting or software cohorts before adopting them.
Tie the review rhythm to action
Record the baseline before activation. In the opening weeks, complete role mapping and validate scoring while keeping the qualification rule and account denominator fixed.
Use the middle and later pilot periods to track meetings, opportunities and stage movement. Log any operational changes so reviewers can distinguish execution adjustments from changes to the evaluation criteria.
Review cadence and the decision each review drives
| Review point | Metrics checked | Decision it drives |
|---|---|---|
| Day 0 baseline | Pipeline per account, win rate, sales-cycle length, meetings per account | Sets the comparison point for the whole pilot |
| Weekly | Engaged target accounts, buying-group coverage, week-over-week engagement growth | Moves sales effort toward accounts with rising engagement |
| Monthly | Meetings per activated profile, opportunities created, median time to opportunity | Adjusts account tiers, roles targeted or message angles |
| Day 90 | Incremental qualified meetings and opportunity progression versus matched accounts, sourced pipeline | Continue, adjust or stop the program against agreed criteria |
Record tier changes as operational decisions, not changes to the original evaluation cohort. Preserve each account's launch classification for analysis and track its current classification separately for execution.
If the sales cycle extends beyond the pilot, use qualified meetings and stage progression as near-term outcomes. Agree on a later closed-revenue checkpoint before launch, and continue observing both cohorts rather than treating open pipeline as proof of success.
Before outreach starts, put the eligible universe, scoring threshold, attribution rules, comparison group, owners and review dates in one measurement sheet. Resolve disagreements with sales and finance in advance.
Ploot turns team expertise into LinkedIn demand, detects buying intent and contacts interested prospects to book qualified sales meetings. Its three-month pilot can be assessed against agreed success criteria, including account progression and pipeline rather than reach alone.