

Only 37% of U.S. B2B marketing decision-makers at companies with at least $100 million in annual revenue or 500 employees measured company-based progress, including pipeline attribution by account and opportunity-to-close rate, in a 2025 Demandbase survey of 509 marketers. The same survey found that just 39% consistently tracked incremental lift in account engagement or spending. Most large teams still watch activity. Far fewer prove that a named-account program added commercial value.
That gap is why account-based marketing KPIs have to be read as a chain, not a pile of lead counts. Coverage and engagement tell you where to spend the next week. Meetings, opportunities, win rate and revenue tell you whether the program moved money. A large influenced-pipeline number is not that proof. It only says an account-based touch happened somewhere before close.
If you sell high-ticket consulting or software, judge whether named accounts advance. Don't score every contact as if each one were a separate deal.
Table of Contents
- ABM KPIs at a Glance by Funnel Stage
- Measuring Buying Groups Instead of Single Leads
- Engagement Signals Versus Proven Pipeline
- Lock the Baseline, Then Run the Pilot
- Common Measurement Mistakes and How to Fix Them
- Take the Scorecard to Sales This Week
ABM KPIs at a Glance by Funnel Stage
Read the set in funnel order. Coverage first, then engagement, then pipeline, then revenue. Earlier ratios predict. Later ratios prove.
| Funnel stage | KPI | How to calculate | What it signals |
|---|---|---|---|
| Coverage | Target-account coverage | Named accounts reached divided by total named accounts | Whether the account list is being worked at all |
| Coverage | Buying-group coverage | Relevant roles engaged divided by roles mapped per account | Breadth of reach across the buying committee |
| Engagement | Intent share | Accounts showing buying signals divided by accounts reached | Which accounts deserve priority effort |
| Engagement | Engaged stakeholders per account | Unique contacts engaged, counted once per account | Depth of interest inside each account |
| Pipeline | Qualified meetings booked | Qualified meetings from target accounts in the period | First hard proof of commercial interest |
| Pipeline | Target-account opportunities | Opportunities created in named accounts | Movement beyond the first conversation |
| Revenue | Opportunity-to-win rate | Closed-won divided by opportunities, per account cohort | Whether ABM improves conversion |
| Revenue | Revenue per activated account | Closed revenue divided by accounts in the program | Overall return on the account list |
How to tell the chain is working
Target-account coverage answers a blunt question. Are you reaching the companies on the list, or only the ones that already like your posts? Buying-group coverage checks roles, not headcount. Intent share then splits reached accounts into those showing buying signals and those that only saw the work. Engaged stakeholders per account counts each person once, so four comments from one director don't look like four buyers.
Pipeline starts only when sales accepts a qualified meeting from a target account, then when that account becomes an opportunity. Revenue closes with opportunity-to-win rate by cohort and revenue per activated account. Cohort matters. A win rate on the named list, set next to a matched group you didn't work, is a fairer test than a blended company average.
Practical rule: Each stage should move the next. Rising engagement with flat meetings is a warning, not a win.
Teams that also keep demand generation KPIs on a separate page can see where broad demand and named-account work diverge, without letting lead volume rewrite the account scorecard.
The minimum you need to start
You don't need a new platform to begin. You need three agreements.
- One named list: Every account has an owner and a reason it is on the list.
- One role map: Economic buyer, technical evaluator, end user and internal champion are named, or marked as still missing.
- One meeting definition: Sales and marketing share a written rule for what counts as qualified.
Without those three, the formulas above produce activity reports. With them, a Monday review has somewhere to land.
Measuring Buying Groups Instead of Single Leads
Lead-based KPIs break the moment one company shows up as three people. Say a partner comments on a pricing post, a senior manager downloads a services page, and an HR director replies to a message. A contact report shows three leads. The buying process shows one committee, still missing the economic buyer.

That pattern is the norm, not an edge case. 72% of B2B purchases involve complex, multi-stakeholder buying groups, according to the Demandbase State of the B2B Buyer Report. Counting contacts as if each were an independent win overstates progress and flatters programs that never reach the people who can say yes.
Breadth and depth
Use two measures, and don't blend them into one score.
Breadth asks how many relevant roles are engaged, against a role map agreed before launch. A workable map for consulting and software deals names the economic buyer, the technical evaluator, the end user and the internal champion. Four titles on a slide aren't coverage. Coverage is those roles engaged, divided by the roles you mapped for that account.
Depth asks whether those people behave like they are evaluating. A profile view is thin. A reply, a meeting request, an internal forward, or a return visit to a services or pricing page is thicker. Seniority belongs in the same note. A champion who keeps reading is useful. A champion plus the economic buyer in the same month is a different stage.
The ladder from there is short. Anonymous or low-intent activity, then identified interest, then sales acceptance, then opportunity creation, then revenue. Shallow activity can sit on the first step for a quarter. It shouldn't be reported as progression.
Count the account once
The de-duplication rule is simple. Count pipeline once per account. Report engaged stakeholders as a separate number. Four contacts at one firm are not four opportunities. If you book two meetings inside that firm, you still have one account moving, unless sales has opened a separate buying center with its own budget.
That rule also keeps partner-led LinkedIn programs honest. Reach from a partner, a director and a senior manager is a leading signal. Qualified conversations, buying-group penetration, sales-accepted meetings, pipeline and closed revenue are the outcome chain. For a practical view of how enquiry quality changes once you stop celebrating raw contact volume, Baikou's guide to boosting qualified enquiries for SaaS is a useful companion, especially where marketing and sales argue over what "qualified" means.
The same logic shows up when you watch how a committee forms, rather than how a single lead score moves.
For each account on the list, you should be able to name the roles reached and the one role still missing. If you can't, the KPI isn't ready to brief sales.
Engagement Signals Versus Proven Pipeline
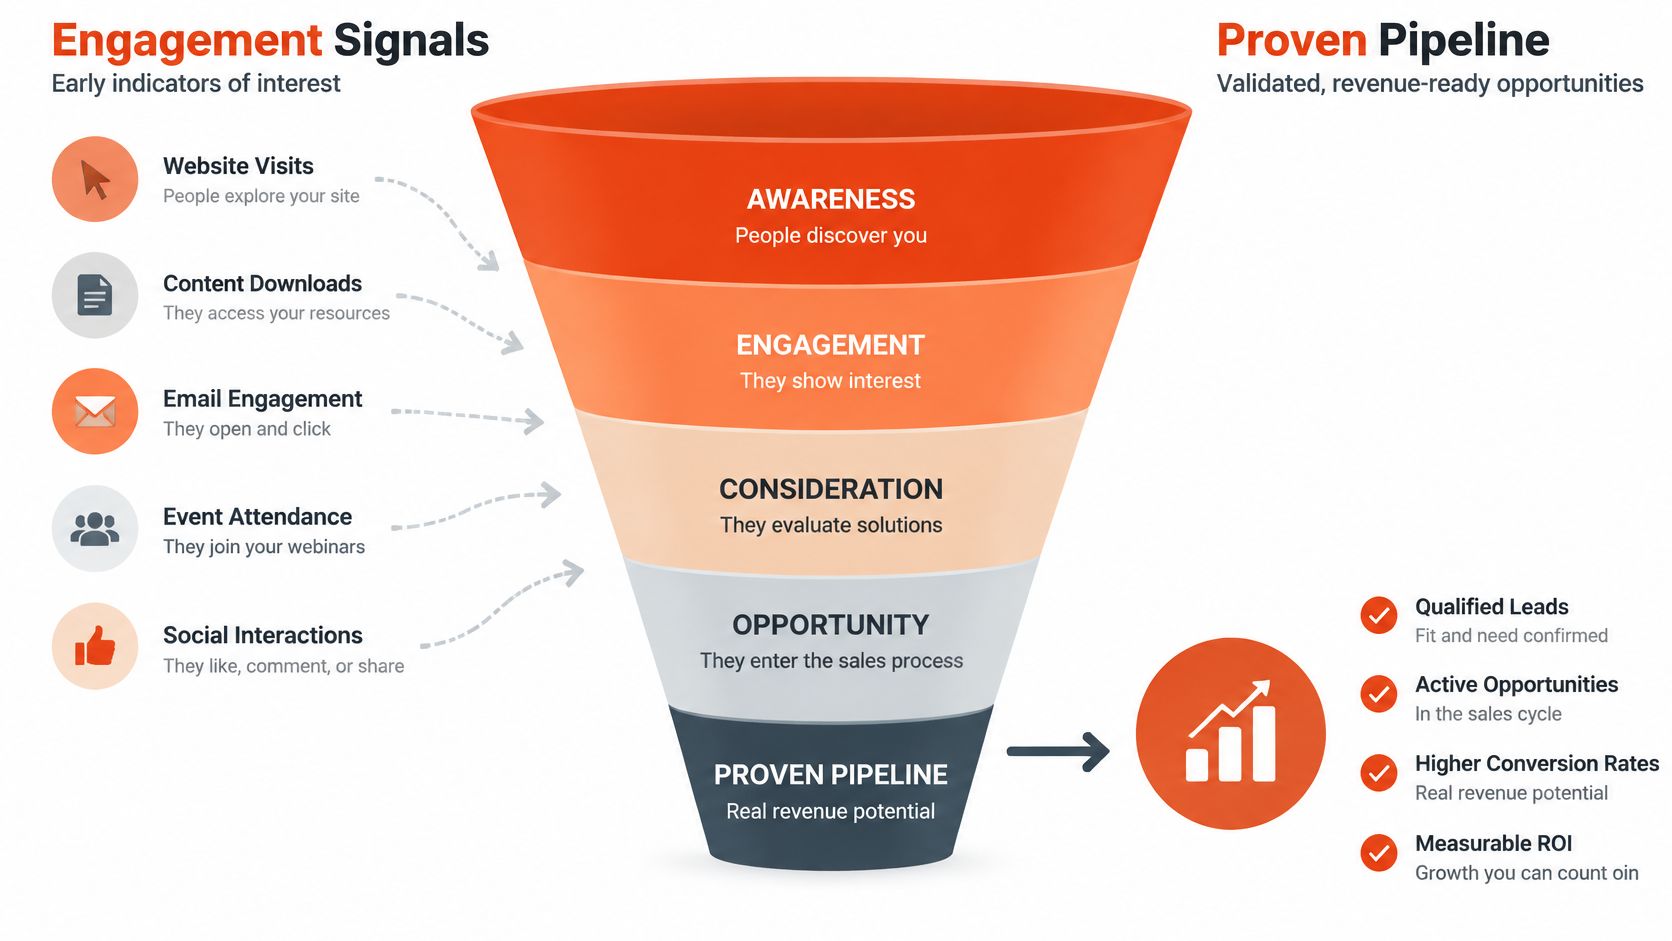
Influenced pipeline records that an ABM touch occurred before close. It does not prove the program created the deal. Treat engagement as a leading signal only, then read the chain in order: account coverage, stakeholder depth, qualified meetings, sales-accepted pipeline, closed revenue. A large influenced number in the middle of that chain is not evidence of causation, even when the figure is accurate.
Lead volume hides the same gap. An account list of forty companies can throw off hundreds of contacts and only a handful of real buying groups. On long, high-ticket cycles, the question is whether those accounts move a stage, not whether individuals collect activity points.
Why attribution stays the hard part
Proving ROI or attribution was the top challenge for 47% of ABM practitioners in the 2025 ABM benchmark, ahead of sales and marketing alignment at 43% and scaling ABM at 40%. Many marketers use both sourced and influenced attribution and still struggle to act on what the labels show. The categories sit on the dashboard. The budget decision they should change often does not.
| Attribution label | What it counts | Main caution |
|---|---|---|
| Sourced | Pipeline that began with an ABM touch | Counts only the first contact and may miss earlier brand work |
| Influenced | Pipeline where an ABM touch occurred before close | Overstates impact, since most deals touch many channels |
| Accelerated | Pipeline that moved faster after ABM activity | Needs a baseline sales cycle to prove the speed-up |
| Expansion | Revenue from existing customers in target accounts | Often driven by account teams rather than marketing |
| Incremental | Pipeline above a matched holdout or baseline group | Hardest to measure but the most defensible evidence |
Sourced is clean and narrow. It ignores the months of authority-building that made the first reply possible. Influenced grows every quarter if any earlier touch gets credit, which is why it cannot stand alone as proof the work caused the pipeline. Accelerated only works if you stored the old sales-cycle length before the program started. Expansion often belongs to the account team that already owned the relationship. Incremental is the comparison a skeptical finance lead can use, because it asks what would have happened in a matched holdout or a pre-program baseline.
What a defensible comparison looks like
Compare target accounts with a matched holdout, or with the same accounts before the program. Report opportunity conversion, win rate and sales-cycle length by cohort. Track time-to-stage as well. Account-based work often earns its keep by speeding progression, not by creating the first touch.
Engagement and intent show where to spend effort. Qualified meetings, opportunities and closed revenue are the validation metrics.
Make incremental sales-accepted pipeline, or qualified meetings from high-intent accounts, the primary success metric. Keep reach, profile engagement and response rates as diagnostics. They explain a miss. They don't replace the commercial outcome. If you want a worked view of how a click becomes something finance will count, Otter A/B's piece on how to turn CTA clicks into revenue shows why micro signals need a downstream owner.
The comparison only holds if the cohorts were fixed before results arrived. Write down the baseline account list, which profiles were activated, how a qualified meeting is defined, which opportunity stages count, and which accounts sit in the control group. Changing those definitions after a strong month turns the holdout into a story, not a test.
The one-quarter test
For each engagement metric on the dashboard, name the later-stage metric it should move within one quarter. Intent share should move meetings. Stakeholder depth should move opportunity creation. If a metric rises and nothing downstream moves, drop it from the executive view. Leave it in the diagnostic tab, where it can still explain a stall without pretending to be revenue.
Lock the Baseline, Then Run the Pilot
Measurement that never leaves the marketing team doesn't change the forecast. In a 2025 benchmark study of 716 B2B practitioners, organizations with an ABM practice were significantly more likely than non-ABM organizations to measure target-account opportunities, target-account pipeline and target-account closed-won deals. They were also more likely to track intent-sourced opportunities, uncontested deal progress and engagement across the buying group. Fewer than 10% of the surveyed metrics were reported to the board. Collecting the number isn't the same as putting it in front of someone who can reallocate budget.
Five locks before anyone publishes
Sit with the sales lead and lock these before launch.
- Write the named account list and the role map for each account, including roles you haven't found yet.
- Define a qualified meeting in one paragraph the sales lead will sign.
- Choose a control cohort of comparable accounts you will not activate.
- Set the monthly review date and the single owner of the page.
- Agree the success threshold in writing, as incremental sales-accepted pipeline or as qualified meetings from high-intent accounts.
Record the baseline on day one. That means the account count, mapped roles, which profiles are active, and the current sales-cycle length. Reach, profile engagement and response rates stay diagnostic. They don't get to be the headline if meetings miss the threshold.
A one-page scorecard is enough for a long cycle. Five lines, each with an owner and a threshold. Account engagement rate, buying-group coverage, intent-triggered meetings, meeting-to-opportunity conversion, and win rate will do more for a leadership meeting than a twenty-row export. A post or a profile view can mean awareness. A meeting, a qualified opportunity or a closed-won deal means the account moved. Our plans include monthly progress reports, so the same five lines can sit in that monthly pack instead of a fresh slide built the night before. The pilot success criteria template is a clean place to write the thresholds before the first week of activity.
A three-month illustration
Treat the figures below as placeholders. Swap in your own list size, your meeting bar and your control group. Say a mid-size consulting firm starts with 40 named accounts and 40 matched control accounts.
Month one checks coverage and intent. In this illustration, 70% of named accounts are reached and 15 show buying signals. If coverage is far below that, fix the list and the active profiles before you argue about pipeline. Nothing downstream is interpretable yet.
Month two checks depth and the meeting bar. Engaged stakeholders per account should rise only when they are new people, counted once. Meetings booked are judged against the threshold you wrote down, not against how busy the inbox felt. A spike in replies that sales won't accept is a definition problem, not a content win.
Month three adds opportunities, win rate and pipeline against the 40 controls. You are looking for a gap, not a perfect attribution story. If targeted accounts create more sales-accepted pipeline than the holdout, you have a case. If they only show more profile views, you don't.
If you want a quick sense of what those meetings are worth before the quarter closes, our ROI calculator estimates added revenue from leads, conversion rate and average contract value, counting 21 working days per month. Use it to pressure-test the threshold, not to replace the cohort comparison.
Translate whatever you find into that one-page scorecard. Five metrics, one owner, one threshold, reviewed on the date you set. That is what reaches a leadership meeting. A metric library does not.
Common Measurement Mistakes and How to Fix Them
The most damaging mistake is treating engagement as success. It shows up as a cheerful chart. Reach keeps climbing, meetings stay flat, and the narrative says the program is "building awareness." On a long cycle, awareness without a meeting is a cost. It persists because marketing can see the posts and sales can see an empty calendar, and nobody agreed which view wins.
| Symptom | Likely cause | Fix |
|---|---|---|
| Engagement rises while meetings stay flat | Reach measured without a qualification rule | Tighten the qualified-meeting definition and review the intent threshold |
| Many contacts but few accounts won | Opportunities counted per contact | Count pipeline once per account and report stakeholders separately |
| Influenced pipeline grows every quarter | Any earlier touch is credited | Report sourced and incremental pipeline alongside influenced |
| Sales ignores the target account list | No agreed stage or acceptance definitions | Agree stage definitions and acceptance rules with sales before launch |
| Results cannot be compared over time | No baseline captured | Record the account list, profiles and cycle length before the first campaign |
| Leadership sees activity only | Metrics not translated into a scorecard | Keep five metrics in a one-page monthly report |
How the other failures keep their place
Double-counting survives because CRM objects are people. One account, four engaged contacts, four opportunities. The correct rule collapses that to one opportunity and a stakeholder count of four. Finance sees a smaller number. It is the number that matches how the deal will close.
Inflated influenced pipeline survives because it never goes down. Any touch before close gets a share, so the bar rises even when the program didn't change the outcome. Put sourced and incremental next to it every month. If those two are flat while influenced climbs, you are relabeling deals you would have had anyway.
A list sales ignores is usually a definition failure, not a motivation failure. If nobody agreed what "accepted" means, reps protect their own forecast and work the accounts they already trust. Write the stage names and the acceptance rule before launch, in the CRM, not in a slide.
No baseline makes every later comparison a story. You can't claim a shorter cycle if you never stored the old one. Capture the account list, the active profiles and the cycle length before the first campaign, even if the numbers embarrass you.
Activity-only leadership packs persist because they are easy to export. A one-page scorecard with five metrics forces a choice about what matters.
A KPI is broken when it rises and no later stage moves. Each month, ask of every metric what decision would change if the number fell by half. If the answer is "none," it doesn't belong on the page sales will read.
Take the Scorecard to Sales This Week
Draft the one-page scorecard this week. Five metrics from the pilot, each with one owner, one threshold and the monthly review date. If a line doesn't have an owner, it won't be updated, and an un-updated line becomes folklore by the second month.
Then check the named list and the role map. Mark every account where the economic buyer, the evaluator, the user or the champion is still unmapped. Those gaps are the work, not a footnote. A list that looks complete and isn't will make month-three pipeline look weaker than the program deserves.
Book the meeting with the sales lead before any campaign starts. Bring the draft. Ask for signed-off thresholds, and agree the qualified-meeting definition and the opportunity stages on paper. A verbal "we'll know a good meeting when we see it" will split the two teams the first time a meeting is soft. For a consulting sales motion, Starward Navigators' sales scorecard for consulting firms is a practical model of how few lines a revenue leader will use. Pair that with a written view of B2B marketing and sales alignment so the stage names match on both sides.
If a metric falling by half wouldn't change a decision, drop it before the first monthly review.
Keep the lines that would change who you call, what you publish, or where budget sits. Leave the rest in the working file.
Ploot turns partner, director and senior-manager profiles into a sales channel for B2B firms with long, high-ticket cycles. We detect buying intent in that audience and contact people who have already shown interest, so the meetings you report are tied to named accounts rather than to impressions. If you want account-based marketing KPIs that end in qualified conversations, visit Ploot and start from a pilot with success criteria you and sales both sign.